ข้อมูลเศรษฐกิจอินโดนีเซีย
ข้อมูลเกี่ยวกับจังหวัดที่สำคัญในอินโดนีเซีย
จังหวัดที่สำคัญในอินโดนีเซีย- เกาะชวา (Java Island)
เกาะชวาถือเป็นเกาะที่มีประชากรอยู่มากที่สุดในอินโดนีเซีย ถือเป็นศูนย์กลางของการค้า การเงิน และ อุตสาหกรรม นอกจากนั้นยังเป็นที่ตั้งของเมืองหลวง คือ กรุงจาร์กาตา นอกจากนั้นยังมี ชวาตะวันตกบันเตน (Banten) ชวาตอนกลาง ยอร์กจาร์กาตา (Yorkjakarta) ซึ่งถือเป็นเขตปกครองพิเศษ จัดเป็นเมืองใหญ่เมืองหนึ่งของอินโดนีเซีย และเคยเป็นเมืองหลวงเก่าแห่งหนึ่งของอินโดนีเซีย รวมถึง ชวาตะวันออก - เกาะสุมาตรา (Sumatra Island)
จังหวัดอาเจ๊ะห์ สุมาตราตอนเหนือ สุมาตราตะวันตก ได้แก่ เบงกูลู (Bengkulu) ริเอา (Riau) จำบี (Jambi) Nanggroe Aceh Darussalam; North Sumatera; สุมาตราตอนใต้ ได้แก่ เมือง ลำปุง (Lampung) บังกา และหมู่เกาะเบลิตุง (Belitung Islands) - เกาะกาลิมันตัน (Kalimanta Island)
กาลิมันตันตะวันตก กาลิมันตันตอนกลาง กาลิมันตันตอนใต้ และ กาลิมันตันตะวันออก - หมู่เกาะนุสันเติงการา (Nasa Tenggara)
Bali; West Tenggara Barat; East Nusa Tenggara - เกาะสุลาเวสี (Sulawesi Island)
สุลาเวสีตะวันตก สุลาเวสีตอนเหนือ สุลาเวสีตอนกลาง สุลาเวสีตอนใต้ สุลาเวสีตะวันออกเฉียงใต้ และ โกรอนทาโล - หมู่เกาะโมลุกกะ และปาปัว (Maluku and papua Islands)
โมลุกกะ โมลุกกะตอนเหนือ ปาปัวตะวันตก และปาปัว

เมืองใหญ่ 10 อันดับในอินโดนีเซีย
(หรือเรียกย่อ ๆ ว่า DKI Jakarta) ตั้งอยู่ในทำเลที่ตั้งที่ดี เป็นเมืองหลวงและศูนย์กลางของหน่วยงานราชการต่าง ๆ ในการบริหารประเทศ DKI Jakarta ครอบคลุมพื้นที่ 7.639 ตารางกิโลเมตร โดยแบ่งเป็นพื้นที่ดิน 661.52 ตารากิโลเมตร และ พื้นน้ำ 6,977.5 ตารางกิโลเมตร มีประชากร 9,041,605 คน (ข้อมูลปี 2005) คิดเป็นความหนาแน่นของประชากร 13.668 คน ต่อ ตารางกิโลเมตร พื้นที่ของกรุงจาร์กาตา ส่วนใหญ่ หรือ 43,788.57 เฮกเตอร์ ใช้เป็นที่อยู่อาศัยและที่เหลือ 4,417.87 เฮกเตอร์ เป็นพื้นที่เพื่อการอุตสาหกรรม ในฐานะที่กรุงจาร์กาตา เป็นเมืองหลวงของประเทศ และศูนย์กลางทางเศรษฐกิจ สาธารณูปโภค และสิ่งอำนวยสะดวกต่าง ๆ เพื่อการติดต่อสื่อสาร และกิจกรรมอื่น ๆ ถูกจัดไว้อย่างครบถ้วน เพื่อสนับสนุนการลงทุน ทั้งสนามบินระหว่างประเทศ 2 แห่ง คือ สนามบินซูการ์โน-ฮัตตา (Soekarno-Hatta) และสนามบินใหม่ฮาร์ลิมเปอร์ดานา กุสุมา (Halim Perdana Kusuma) และท่าเรือ ตันจุง พริออก (Tanjung Priok) รวมถึง การขนส่งทางบก และทางรถไฟ ที่เปิดให้บริการตลอด 24 ชั่วโมง
เป็นเมืองหลวงของชาวตะวันออก และเป็นเมืองใหญ่อันดับสอบของประเทศ มีประชากรโดยประมาณ 3 ล้านคน สุราบายา ถือเป็นประตูการค้าสู่อินโดนีเซียด้านตะวันออก เป็นเมืองที่มีศักยภาพทั้งด้านเศรษฐกิจ และสิ่งอำนวยสะดวกต่าง ๆ ตลอดจนภูมิประเทศที่ได้เปรียบเป็นเมืองที่มีท่าที่ใหญ่ที่สุดในประเทศอินโดนีเซีย
เป็นเมืองหลวงของสุมาตราตอนเหนือ ตั้งอยู่ใกล้กับชายฝั่งทางตอนเหนือของเกาะสุมาตรา จัดเป็นเมืองใหญ่อันดับ 3 ของประเทศ แต่มักเป็นที่รู้จักของคนทั่วไปในอันดับที่ 4 ถัดจาก จาร์กาตา สุราบายา บันดุง เมดาน มีประชากรประมาณ 2,083,156 คน ในปี 2007 เมดานเป็นศูนย์กลางของการค้าที่สำคัญแห่งหนึ่งของอินโดนีเซีย มีนักธุรกิจชาวจีนอยู่อาศัยในเมืองนี้เป็นจำนวนมาก
เป็นเมืองหลวงของชวาตะวันตก อยู่ทางทิศตะวันออกเฉียงใต้ของกรุงจาร์กาตา 180 กิโลเมตร จัดเป็นเมืองใหญ่อันดับ 4 ของประเทศมีประชากรประมาณ 2.9 ล้านคน (ณ ปี 2007) เป็นเมืองที่มีเชื่เสียงในเรื่องของอุตสาหกรรมสิ่งทอ และเครื่องหนังของประเทศ และเป็นเมืองในต่างจังหวัด ที่มีอัตราการเจริญเติบโตที่สูง ถือเป็นเมืองที่มีอัตราความหนาแน่นของประชากรมากที่สุดแห่งหนึ่งในเอเชีย และมีประชากรมากว่า 7.2 ล้านคนที่อาศัยอยู่รอบ ๆ เมืองบันดุง
เป็นเมืองหลวงของชวาตอนกลาง มีพื้นที่ 225.17 ตารางกิโลเมตร มีประชากรประมาณ 1.5 ล้านคน จัดเป็นเมืองใหญ่อันดับที่ 5 ของประเทศ
มีชื่อเสียงในการเป็นศูนย์กลางของศิลปะสไตล์ชวาประเภทต่าง ๆ เช่น ผ้าบาติก การเต้น ละคร ดนตรี บทกวี และการแสดงหนังตะลุง รวมถึงการเป็นศูนย์กลางของการศึกษาขั้นสูง เป็นที่ตั้งของมหาวิทยาลัยจำนวนมาก และบูโรพุทโธ ซึ่งถือเป็นมหาเจดีย์ของศาสนาพุทธที่ใหญ่ที่สุดในโลก จัดเป็นสิ่งมหัศจรรย์ 1 ใน 7 ของโลก
เป็นเมืองหลวงของเกาะสุมาตราตอนใต้ ตั้งอยู่ทางฝั่งตะวันออกของเกาะบนฝั่งแม่น้ำมูสี (Musi River) มีพื้นที่ 40,061 ตารางกิโลเมตร และประชากร 1,441,500 คน เป็นเมืองใหญ่อันดับสองของเกาสุมาตรารองจากเมืองเมดาน และจัดเป็นเมืองใหญ่อันดับ 7 ของประเทศ
เป็นเมืองหลวงของเกาะสุลาเวสีตอนใต้ และถือเป็นเมืองใหญ่ที่สุดของเกาะ มีเมืองท่าที่สำคัญที่ใช้ในการขนส่งสินค้าภายในประเทศระหว่างเกาะต่าง ๆ รวมถึง การค้าระหว่างประเทศ มีประชากรประมาณ 1.22 ล้านคน
เป็นเมืองหลวงของเกาะกาลิมันตันใต้ ตั้งอยู่บนปากแม่น้ำใกล้กับทางแยกระหว่างแม่น้ำบาริโตและแม่น้ำมาร์ตาปูระ (Barito and Martapura rivers) ซึ่งส่งผลให้บางครั้ง เมืองนี้ถูกขนานนามว่าเป็นเมืองแม่น้ำ มีประชากรประมาณ 602,700 คน
เป็นเมืองหลวงของเกาะบาหลี ซึ่งเป็นเมืองท่องเที่ยวที่มีชื่อเสียงในเรื่อง ชายหาดที่สวยงามและศิลปะสไตล์บาหลีประเภทต่าง ๆ ได้แก่ ผ้าบาติก เครื่องเงิน การแกะสลักไม้ การจัดสวน รวมถึงขนบธรรมเนียมประเพณี ความเชื่อ ดั้งเดิมของชาวบาหลี เป็นที่ตั้งของสนามบินระหว่างประเทศ นูราลัย (Ngurah Rai Airport) มีประชากรประมาณ 491,500 คน
แหล่งข้อมูล: สำนักงานส่งเสริมการค้าระหว่างประเทศ ณ กรุงจาการ์ตา
ผลิตภัณฑ์มวลรวมในประเทศ (Gross Domestic Products: GDP)
วิกฤตการเงินทั่วโลกที่เกิดขึ้นจากความผิดพลาดเรื่องการปล่อยสินเชื่อที่ไม่มีคุณภาพของประเทศสหรัฐอเมริกา และการเปลี่ยนแปลงราคาน้ำมันดิบ ส่งผลกระทบต่อการส่งออกของอินโดนีเซียบ้าง แต่ผลิตภัณฑ์มวลรวมในประเทศ หรือ GDP ของอินโดนีเซียในปี 2008 ก็ยังเพิ่มสูงขึ้นประมาณ 6.1% แม้ว่าจะน้อยกว่าปี 2007 ที่มีอัตราการเพิ่มสูงถึง 6.32% ก็ตาม
ผลิตภัณฑ์มวลรวมในประเทศของอินโดนีเซีย ณ ราคาตลาดที่คงที่ (2004-2008)
| ปี | GDP (ล้านรูเปีย) | อัตราการเติบโต (%) |
| 2004 | 1,660.6 | 5.13 |
| 2005 | 1,749.5 | 5.60 |
| 2006 | 1,846.7 | 5.50 |
| 2007 | 1,964.0 | 6.30 |
| 2008 | 2,082.1 | 6.10 |
พบว่าผลิตภัณฑ์มวลรวมในประเทศเกือบทุกภาคเศรษฐกิจ เป็นผลจากการบริโภคของรัฐบาลที่เพิ่มขึ้นในปี 2008 ถึง 16.87% โดยที่ปี 2007 การใช้จ่ายของรัฐบาลเพิ่มสูงขึ้นเพียง 3.89% แสดงให้เห็นว่าการใช้จ่ายของรัฐบาลทั้งที่เป็นรายจ่ายประจำและรายจ่ายเพื่อการพัฒนาประเทศ เป็นตัวเร่งที่สำคัญต่อการเพิ่มขึ้นของผลิตภัณฑ์มวลรวมในประเทศ
อัตราการเจริญเติบโตของ GDP แยกตามประเภทของรายจ่ายช่วงปี 2006-2008 (หน่วย : ร้อยละ)
| ประเภทของรายจ่าย | 2006 | 2007 | 2008 | 2009 |
| รายจ่ายเพื่อการบริโภคของภาคเอกชน | 3.2 | 5.0 | 5.3 | 4.8 |
| รายจ่ายของภาครัฐบาล | 9.6 | 3.9 | 10.4 | 17.0 |
| รายจ่ายเพื่อสินทรัพย์คงที่ | 2.9 | 9.2 | 11.7 | 2.7 |
| การส่งออกสินค้าและบริการ | 9.2 | 8.0 | 9.5 | -15.7 |
| การนำเข้าสินค้าและบริการ | 7.6 | 8.9 | 10.0 | -23.9 |
| GDP | 5.5 | 6.3 | 6.1 | 4.0 |
ที่มา: BPS (Central Bureau of Statistics)
ดังนั้น ตัวขับเคลื่อนการเจริญเติบโตเศรษฐกิจของประเทศ คือ การใช้จ่ายของภาครัฐ ในปี 2009 รายจ่ายของภาครัฐนั้นส่วนใหญ่เป็นค่าใช้จ่ายที่ใช้ในช่วงรณรงค์การเลือกตั้ง

การขยายตัวของผลิตภัณฑ์มวลรวมในประเทศแยกตามเศรษฐกิจรายภาค
ภาคการขนส่งและการติดต่อสื่อสาร ยังคงเป็นภาคสำคัญที่ก่อให้เกิดการขยายตัวทางเศรษฐกิจของประเทศ การขนส่งทางอากาศ และการติดต่อสื่อสารทางไกลขยายตัวเพิ่มขึ้นอย่างรวดเร็วในปี 2008 ซึ่งแสดงได้จากการเพิ่มขึ้นของจำนวนสายการบิน และธุรกรรมด้านโทรศัพท์เคลื่อนที่ ทั้งนี้ใน 3 ไตรมาสของปี 2008 ภาคการขนส่งและการติดต่อสื่อสาร ขยายตัวเพิ่มสูงขึ้น 17.11% มากกว่า ปี 2007 ที่มีการเพิ่มขึ้น เพียง 14.38%
ภาคการเกษตร ผลผลิตมวลรวมฯ ได้ลดลง โดยในปี 2008 ภาคการเกษตร มีการเพิ่มสูงขึ้นเพียง 2.43% ขณะที่ปี 2007 มีการเพิ่มขึ้น 3.7% ซึ่งเป็นผลจากการลดลงของราคาของผลผลิตทางการเกษตรที่สำคัญ คือ ปาล์มน้ำมัน ยางพารา โกโก้ โดยเฉพาะในไตรมาสสุดท้ายของปี 2008 ภาคอุตสาหกรรมก็มีอัตราการขยายตัวลดลงเหลือเพียง 4.25% ในปี 2008 จาก 4.66% ในปี 2007 เนื่องจากต้นทุนการผลิตที่เพิ่มขึ้นอันเป็นผลกระทบจากราคาน้ำมันและอัตราดอกเบี้ยที่เพิ่มสูงขึ้น รวมถึงภาคเหมืองแร่ ก็มีอัตราการขยายตัวลดลงในทำนองเดียวกัน
อัตราการเจริญเติบโตของผลผลิตมวลรวมในประเทศแยกตามเศรษฐกิจรายภาคระหว่างปี 2005-2008 (%)
| ภาคเศรษฐกิจ | 2005 | 2006 | 2007 | 2008 | |
| 1. | เกษตรกรรม | 2.66 | 2.98 | 3.50 | 2.43 |
| 2. | เหมืองแร่ | 3.11 | 2.21 | 1.98 | 1.65 |
| 3. | อุตสาหกรรม | 4.57 | 4.63 | 4.66 | 4.25 |
| 4. | ไฟฟ้า ก๊าซ และน้ำดื่ม | 6.30 | 5.87 | 10.40 | 10.63 |
| 5. | การก่อสร้าง | 7.42 | 8.97 | 8.61 | 7.48 |
| 6. | การค้า โรงแรม และภัตตาคาร | 8.38 | 6.13 | 8.46 | 7.58 |
| 7. | การขนส่ง และการติดต่อสื่อสาร | 12.97 | 13.64 | 14.38 | 17.11 |
| 8. | การเงิน การเช่าซื้อ | 6.79 | 5.65 | 7.99 | 8.54 |
| 9. | การบริการ | 5.05 | 6.22 | 6.60 | 6.71 |
| ผลผลิตมวลรวมในประเทศทั้งหมด | 5.68 | 5.48 | 6.32 | 6.11 | |
| ผลผลิตมวลรวมในประเทศที่ไม่ใช่ น้ำมัน และก๊าซธรรมชาติ | 6.57 | 6.09 | 6.92 | 6.55 | |
| ผลผลิตมวลรวมในประเทศที่เป็นน้ำมัน และก๊าซธรรมชาติ | (3.20) | (1.27) | (0.81) | 0.32 | |

ผลิตภัณฑ์มวลรวมภายในประเทศเฉลี่ยต่อหัว
ระหว่างปี 2005-2008, ผลิตภัณฑ์มวลรวมในประเทศเฉลี่ยต่อหัว เพิ่มสูงขึ้นโดยตลอดจาก 12.6 ล้านรูเปีย (US$ 1,311.7) ในปี 2005, เป็น 15 ล้านรูเปีย (US$ 1,658.4) ในปี 2006, เป็น 17.5 ล้านรูเปีย (US$ 1,937.4) ปี 2007 และเพิ่มเป็น 21.7 ล้านรูเปีย (US$ 2,271.2) ในปี 2008
ขณะที่ผลิตภัณฑ์มวลรวมประชาชาติ (Gross National Product: GNP) ต่อหัวได้เพิ่มขึ้นในช่วงปี 2005-2008 เฉลี่ยอยู่ระหว่าง 16.9% - 24.6% ต่อปี ผลิตภัณฑ์มวลรวมประชาชาติต่อหัวเฉลี่ยประมาณ 12 ล้านรูเปีย (US$ 1,247.8) ในปี 2005 และเพิ่มขึ้นเป็น 20.9 ล้านรูเปีย (US$ 2,190.5) ในปี 2008
GDP และ GNP เฉลี่ยต่อหัว ในอินโดนีเซีย ช่วงปี 2005-2008
| 2006 | 2007 | 2008 | 2009 | |
| GDP ต่อหัว ณ ราคาตลาดปัจจุบัน | ||||
| มูลค่า (ล้านรูเปีย) | 12.6 | 15.0 | 17.5 | 21.7 |
| อัตราการเติบโต (%) | 18.9 | 18.8 | 16.8 | 23.9 |
| มูลค่า (US$) | 1,311.7 | 1,658.4 | 1,937.4 | 2,271.2 |
| GNP ต่อหัว ณ ราคาตลาดปัจจุบัน | ||||
| มูลค่า (ล้านรูเปีย) | 12.0 | 14.4 | 16.8 | 20.9 |
| อัตราการเติบโต (%) | 18.6 | 19.6 | 16.9 | 24.6 |
| มูลค่า (US$) | 1,247.8 | 1,587.7 | 1,857.7 | 2,190.5 |
แหล่งข้อมูล: สำนักงานส่งเสริมการค้าระหว่างประเทศ ณ กรุงจาการ์ตา
Overall Economy
Indonesia is the largest archipelago as a nation with the total land of 1,870,000k㎡, having total population of 237.5million (The world fourth largest). Since the financial crisis of 1997, Indonesia has been successful in recovering the economy which has kept expanding nominal GDP in past ten years consecutively. It achieved US$ 510.8 billion of nominal GDP in 2008. Despite the
| Indonesia | Thailand | Indonesia / Thailand*100 |
||
| Nominal GDP | USD (Billion) | 510.8 | 273.2 | 187.0 |
| Population | Million | 237.5 | 67 | 354.5 |
| GDPPC | USD | 2,246 | 4,080 | 55.0 |
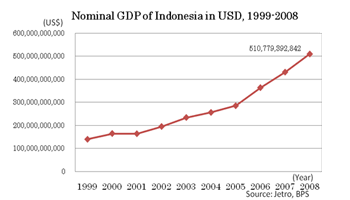
world economic downturn triggered by the United States in the same year, the GDP growth rate of 2009 was positive at 4.5% (Only three economies in the world). Moreover, the government expects further increase to 5.5% in 2010. Having more than 3.5 times larger population than Thailand, GDP per capita counts only US$ 2,246 which is almost half amount of Thailand. However, achieving 187% of nominal GDP, Indonesia is literally the largest economy in Southeast Asia in addition to its population size.
President Susilo Bambang Yudhoyono was re-elected winning more than 60% of the total votes at the presidential election held in July 2009. The new cabinet's policies on economic aspects for next five years can be summarized by 1) further economic growth and 2) correction of social disparity, which were derived from the presidential inaugural speech described as "enhancement of people's prosperity, the strengthening of democracy and of justice".
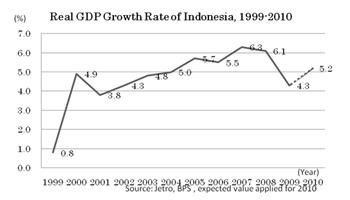
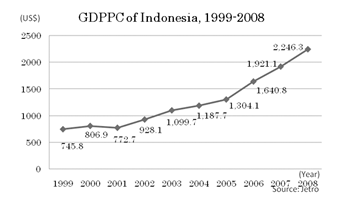
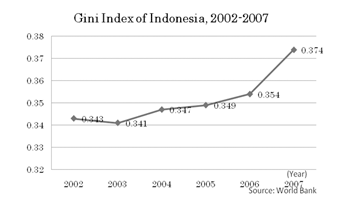
Despite the positive dimension of constant economic growth, there is a shadow casting fact having existed, which is highly skewed wealth distribution. Indonesia is known as a nation showing a strong degree of poverty gap as Gini coefficient indicates. The indexes from 2003 to 2007 show that disparity has become wider. Thus, the economic policy of Indonesia is planned and implemented focusing on "correction of social disparity" for coming years.
Component and Share of GDP
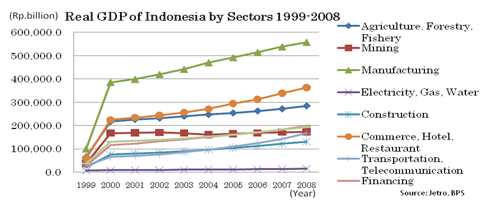
The chart below elaborates the GDP of Indonesia by sectors from 1999 to 2008. As nominal GDP almost tripled during the same period as explained in the previous section, most sectors have grown the values of real GDP consistently during the period. Only exception would be Mining sector. The value had a declining trend until 2004 marking Rp.160,100 billion. Although GDP of mining sector has recovered in 2006 at the same level of 2000, its trend should be described as quite flat. This can be considered as a result from (1) government policy in restricting excess supply, which mining companies are required to supply at least 25% of the products to the local market and (2) the government regulations especially on land acquisition.
The contribution of Electricity, Gas, and Water may seem to be flat as well. However, it has expanded from the value of Rp.8,393 billion in 2000 to nearly Rp.15,000 billion in 2008. Thus, GDP of this sector has also increased along the expansion of economic growth.
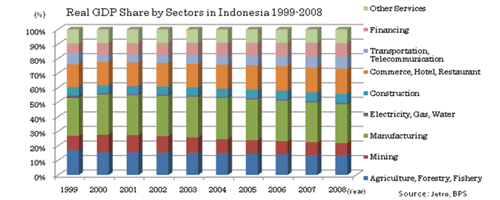
On the other hand, the share of real GDP in Indonesia intuitively seldom changed in the past decade. This fact may seem to be consistent with the charts already shown. If each sector has tripled the production amount when GDP has tripled, the share itself does not change at all. However, there are some trend changes which this chart can imply. Firstly, as indicated previously, the share of mining industry has to decline due to stable contribution to the GDP while other sectors had increasing trends. In fact, mining industry had 12.07% of the share in 2000. It declined to 8.28% in 2008. Secondly, agriculture sector has a slightly declining trend over the past decade. Agriculture is still an expanding sector in Indonesia as its contribution to GDP increased from Rp.216,831 billion in 2000 to Rp.284,337 billion in 2008. However, its share has declined since 1999 continuously.
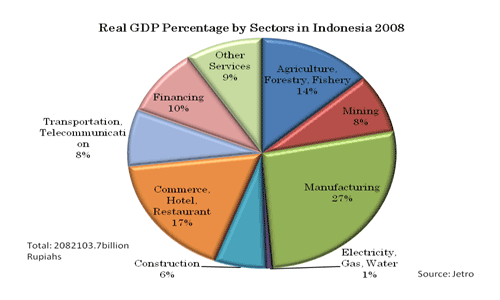
Though agriculture sector had 17.13% of share to GDP in 2000, its contribution declined to 13.66%. Thirdly, construction has an expanding trend in recent years increasing its share above 6% in 2008 from 5.5% in 2000. Fourthly, comparatively large degree of increase is seen in transportation and telecommunication sectors. Its share was 4.68% in 2000 and increased to 7.98% in 2008. The chart below shows the share of real GDP by sectors in 2008. The largest share is a manufacturing sector marking 27%. Agriculture and mining sectors are still large components to GDP of Indonesia although their contribution is declining in recent years.
Regional Economy
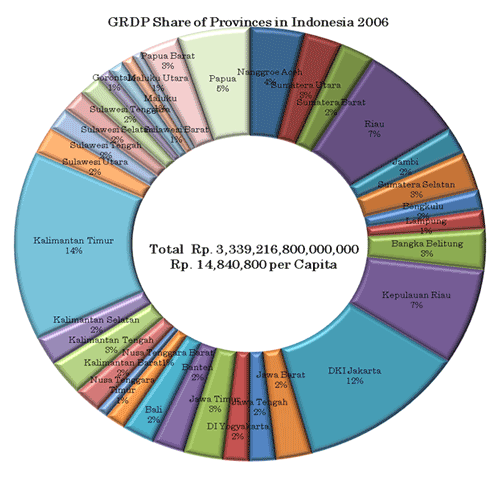
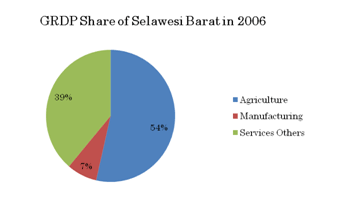
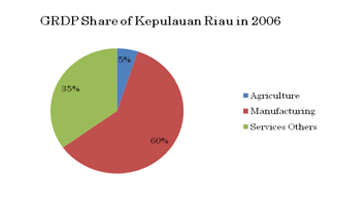
Overview of the regional economy can be examined by Gross Regional Domestic Products (GRDP) share chart in below. Total GDP of Rp.3,339 trillion in 2006 is composed of GRDP of 33 provinces nationwide. Kalimantan Timur contributes the largest share of 14%, which results in Rp.67,627 thousand as per capita. The second largest is DKI (Daerah Khusus Ibukota) Jakarta 12%, which results in Rp.55,960 thousand per capita. Only four provinces of DKI Jakarta, Kalimantan Timur, Kepulauan Riau and Riau occupy 40% of GDP of this nation in 2006.
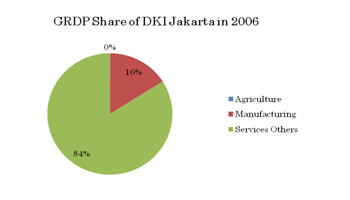 |
Naturally, each province has a peculiar style of economy. One depends much on agricultural industry while others depend on service sectors mainly. Three unique provinces are introduced in below. GRDP of Selawesi Barat is composed of 54% of Agriculture, 7% of Manufacturing, and 39% of Service sectors. A manufacturing dominated province is represented by Kepulauan Riau, which shows 60% of GRDP contributed by manufacturing industry. DKI Jakarta's economy mainly relys on service sectors, which marks 84% for the service industry. Agriculture contributes 0.1%, which was described as zero in the chart. |
Trade
What has supported expanding GDP of Indonesia over a past decade is nothing but constant positive trade balance. Both export and import are in an increasing trend although there was a slightly decreasing trend during 2001 and 2002. Trade amount increased tremendously from 2004. Export has expanded almost 2.5 times in 2008 compared with that of 1999, while import has increased more than 4 times of 1999, which resulted in a decrease of trade balance.
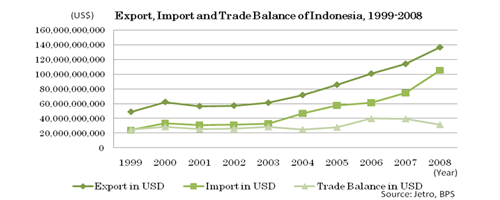
One of the reasons for the decrease in trade balance in recent years is due to world's economy recession triggered by financial crisis in the USA. However, there is also a big trend change in a regional trade scheme, which is ASEAN China Free Trade Agreement (ACFTA). ACFTA has been effective since January 1st of 2010. This is to abolish tariffs on 6,682 trading items between China and ASEAN in 17 sectors including manufacturing, agriculture, mining, and maritime sectors. This agreement is to allow 228 disadvantageous items for Indonesia to flow into Indonesian markets which could threaten domestic manufacturers such as garments, textiles, furniture, footwear, toys, and more.
Considering both the world's economic recession and expansion of FTA among the regional economies, Indonesian economy cannot depend on only world economies for a long term as it has enjoyed positive trade balance in the past. Recently, Indonesian government is trying to achieve economic growth by developing a domestic market. The government is supporting domestic manufacturers by lowering their production cost as well as transportation cost through such as provision of infrastructures, tax rates cut etc. so that they could compete with cheaper products from China.
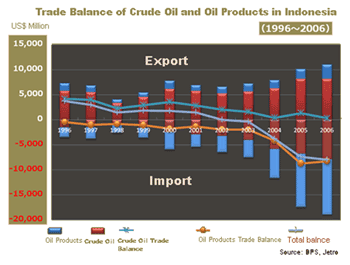
Another significant change in recent years in terms of trade in Indonesia is oil trade balance. Indonesia has been long an oil exporting nation. This has changed since 2008 as Indonesia has withdrawn its name from OPEC member countries. This is due to the fact that Indonesia is no more oil exporting country. The chart shows a rapid increase in importing both crude oil and oil products since 2004, although exporting amount has not changed much. Examining only crude oil industry, export still excesses import. However, total trade balance including oil products has been negative already.
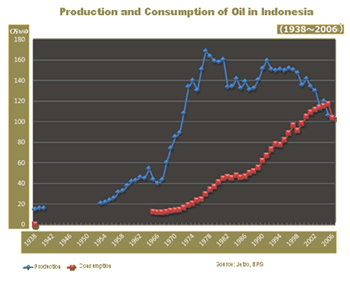
This is simply due to an increased demand of oil in a domestic market. The chart below shows how consumption of oil has exceeded production in Indonesia. Although there are no data available from 1941 to 1952 due to Japanese domination and their independence war, the two curves clearly shows how consumption of oil in Indonesia increased dramatically and exceeded the amount of production.
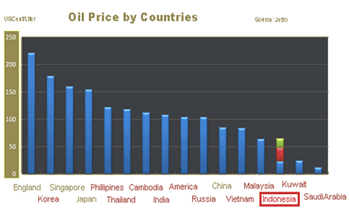
Having excess demand over short supply, Indonesia also seems to suffer from an increase of oil market price just as other oil importing countries do. The problem for Indonesia is rather its degree. Having being an oil exporting country for long time, Indonesia could manage a cheap and stable oil price for the domestic market for long time through subsidy by the government, which it allocated the profit of oil exports to the subsidy for domestic market. As data shows before, however, Indonesia is not an oil exporting country anymore. Thus, Indonesia had to seek for another budget resource to subsidize in order to keep oil price low. As the budget situation did not allow the government to subsidize, they had to cut the subsidy to the oil, which resulted in an increase of oil price in the domestic market. Thus, Indonesia doubled the oil price in 2005 to almost 50 cents per liter, which is still much lower than the world oil market price. The government plans to increase another 30% of the price to the same level of oil price in Malaysia. However, this strong degree of increasing price is likely to affect local economy severely because oil is essential for local people especially those who spend most of the income for food and daily necessities as they cook with gas everyday and most goods they consume are transported by oil fuel vehicles.
This whole situation leads to an idea of usage of bio-fuel energy considering existing agricultural commodities as palm oil, sugar cane, and so forth. This results in an increase of demand for those daily essential commodities leading to inflation. Thus, the Indonesian government's challenge behind the change of trade in recent years is to keep these commodities prices stable minimizing negative impact for people's life.
แหล่งข้อมูล: สอท. ณ กรุงจาการ์ตา
ค้นหาข้อมูลเพิ่มเติมได้ที่ http://www.mfa.go.th/web/1312.php?depid=207


